v1.4.0
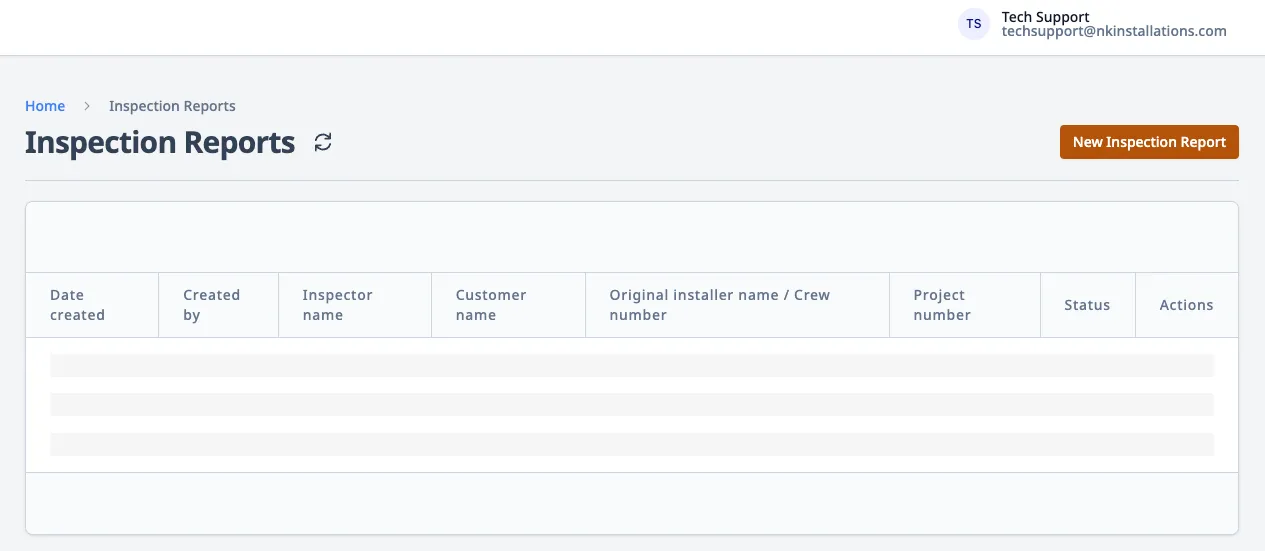
New Inspection Reports Chart
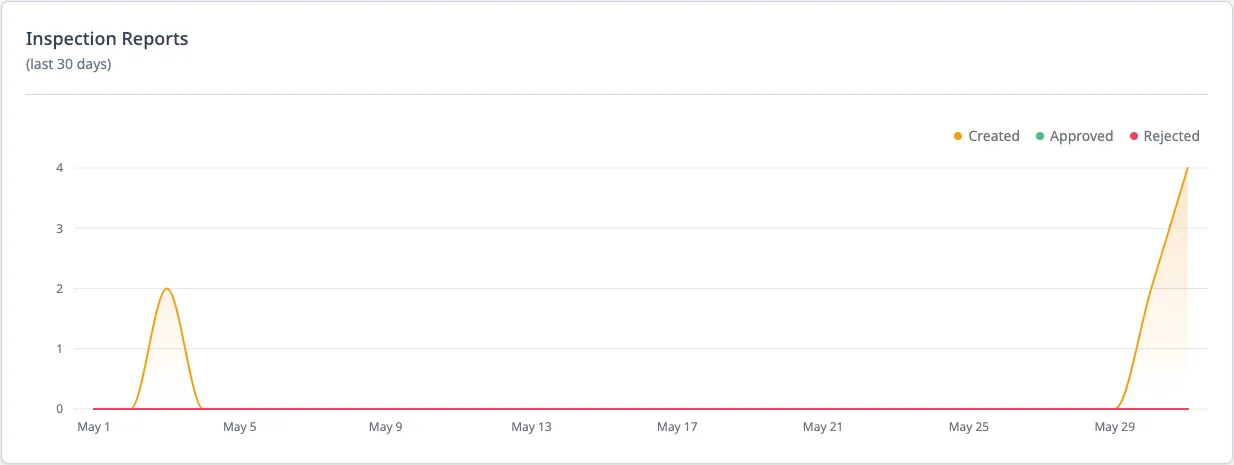
Introducing the Inspection Reports Chart, a vital tool designed to enhance the efficiency and transparency of your inspection management process.
The dashboard presents a concise visualization of inspection reports created, approved, and rejected over the last 30 days. With data points marked on the graph, you can quickly gauge the volume of inspections handled and their outcomes.
Each graph is updated in real-time to reflect the most recent data, ensuring you have access to the latest information.
Color-coded indicators make it easy to distinguish between created (yellow), approved (green), and rejected (red) reports, providing an at-a-glance overview of inspection outcomes.
Including trend lines allows users to identify patterns over the period, helping to spot increases in inspections or changes in approval rates, as seen in the recent surge of created reports.
With up-to-date and easy-to-read data, stakeholders can make informed decisions about resource allocation, process adjustments, and quality control measures. The clear display of approved and rejected inspections promotes transparency and accountability within the inspection process. The dashboard simplifies monitoring inspection activities, saving time and effort in compiling and analyzing reports manually.
Fixes and Improvements
We have been hard at work finding bugs and working on various improvements. In this release, the following issues were resolved:
We fixed an issue when people got stuck when logging in for the first time and being automatically redirected to a page. (v1.3.3)
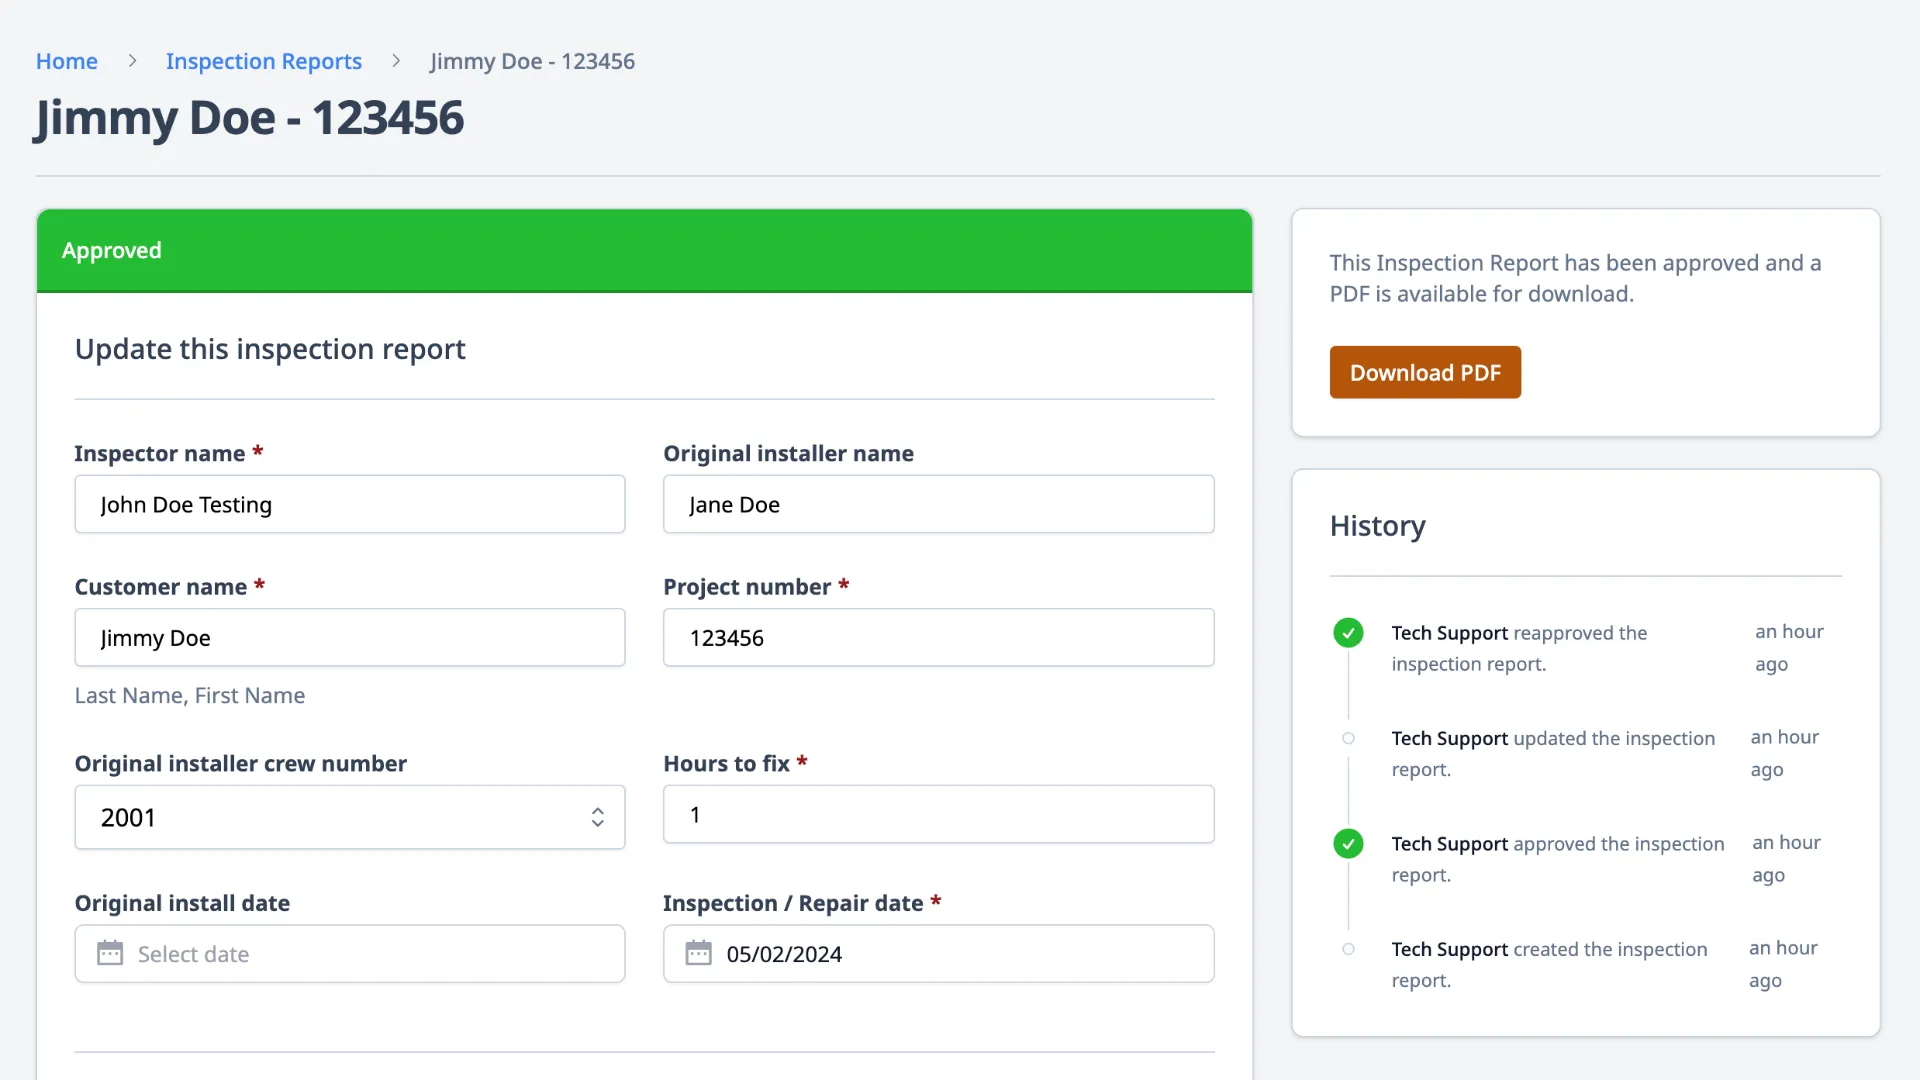
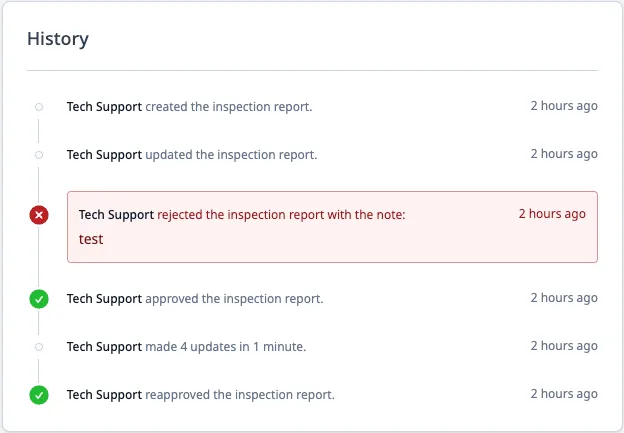
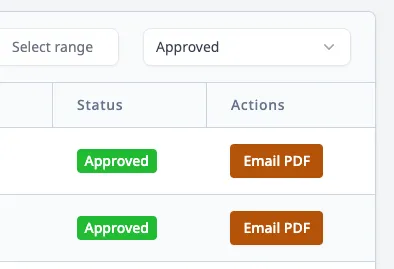
We fixed an issue with approving an Inspection Report. The app wouldn’t allow it to happen. We’ve fixed this and reports can now be approved. (v.1.3.3)
We fixed an issue with the hours input on the Inspection Report. The app would only allow integers (i.e. 1, 2, 3, etc.) and not floats (0.5, 1.5, etc.). This is now fixed and the app accepts floats for that field. (v 1.3.4)